


Quick View:
Michigan Crime Map 2026
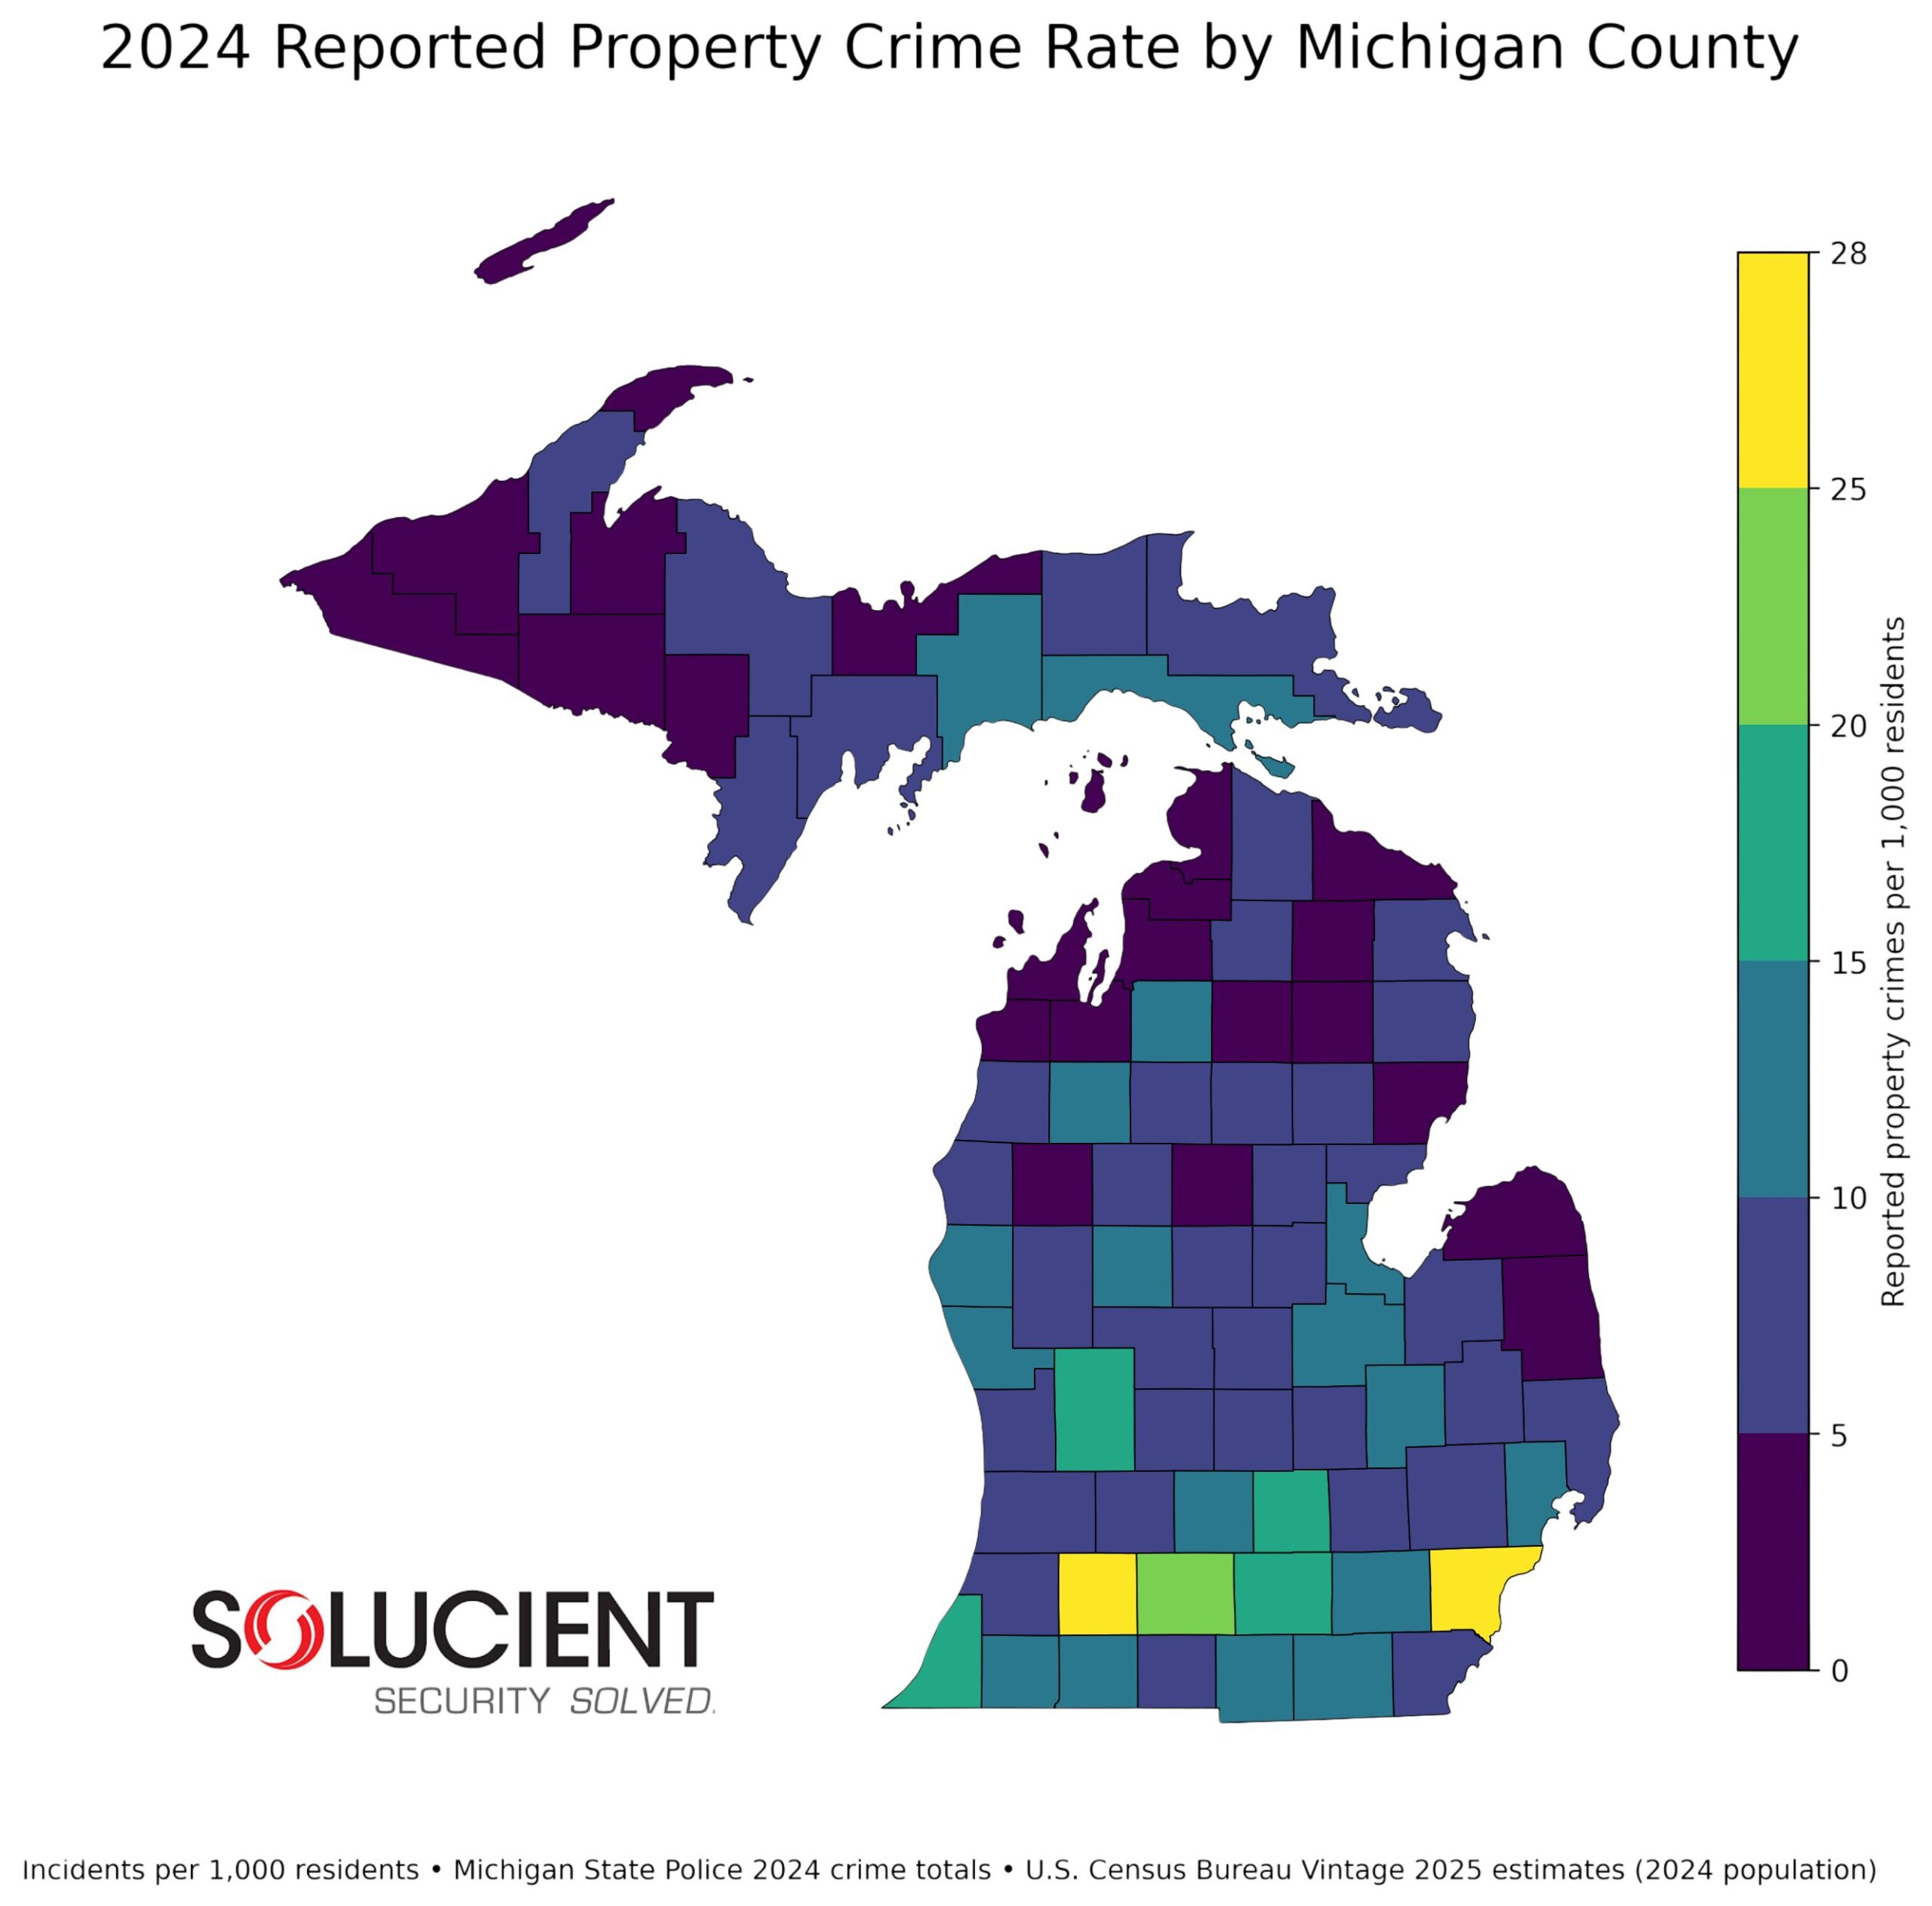
MICHIGAN CRIME MAP: PROPERTY CRIMES PER 1,000 RESIDENTS
Highest
[25+]
Higher
20-24.9
High
15 – 19.9
Elevated
10 – 14.9
Moderate
5 – 9.9
Lower
Under 5
We’ve updated our original 2022 Michigan crime map categories shown previously.
Kalamazoo County increased to approximately 26.7 property crimes per 1,000 residents, while Wayne County was approximately 25.7. Calhoun County was approximately 22.1. By contrast, Oceana County—previously shown in one of the highest groups on the older Michigan Crime Map—was approximately 11.8 per 1,000 using the updated 2024 data.
Some of the original hot spots remain visible, but their relative positions have changed, and unlike our prior report, we examine reduced crime rates in Michigan.
In this article, we examine the decrease in Michigan’s crime rates and make comparisons by counties and cities throughout Michigan.
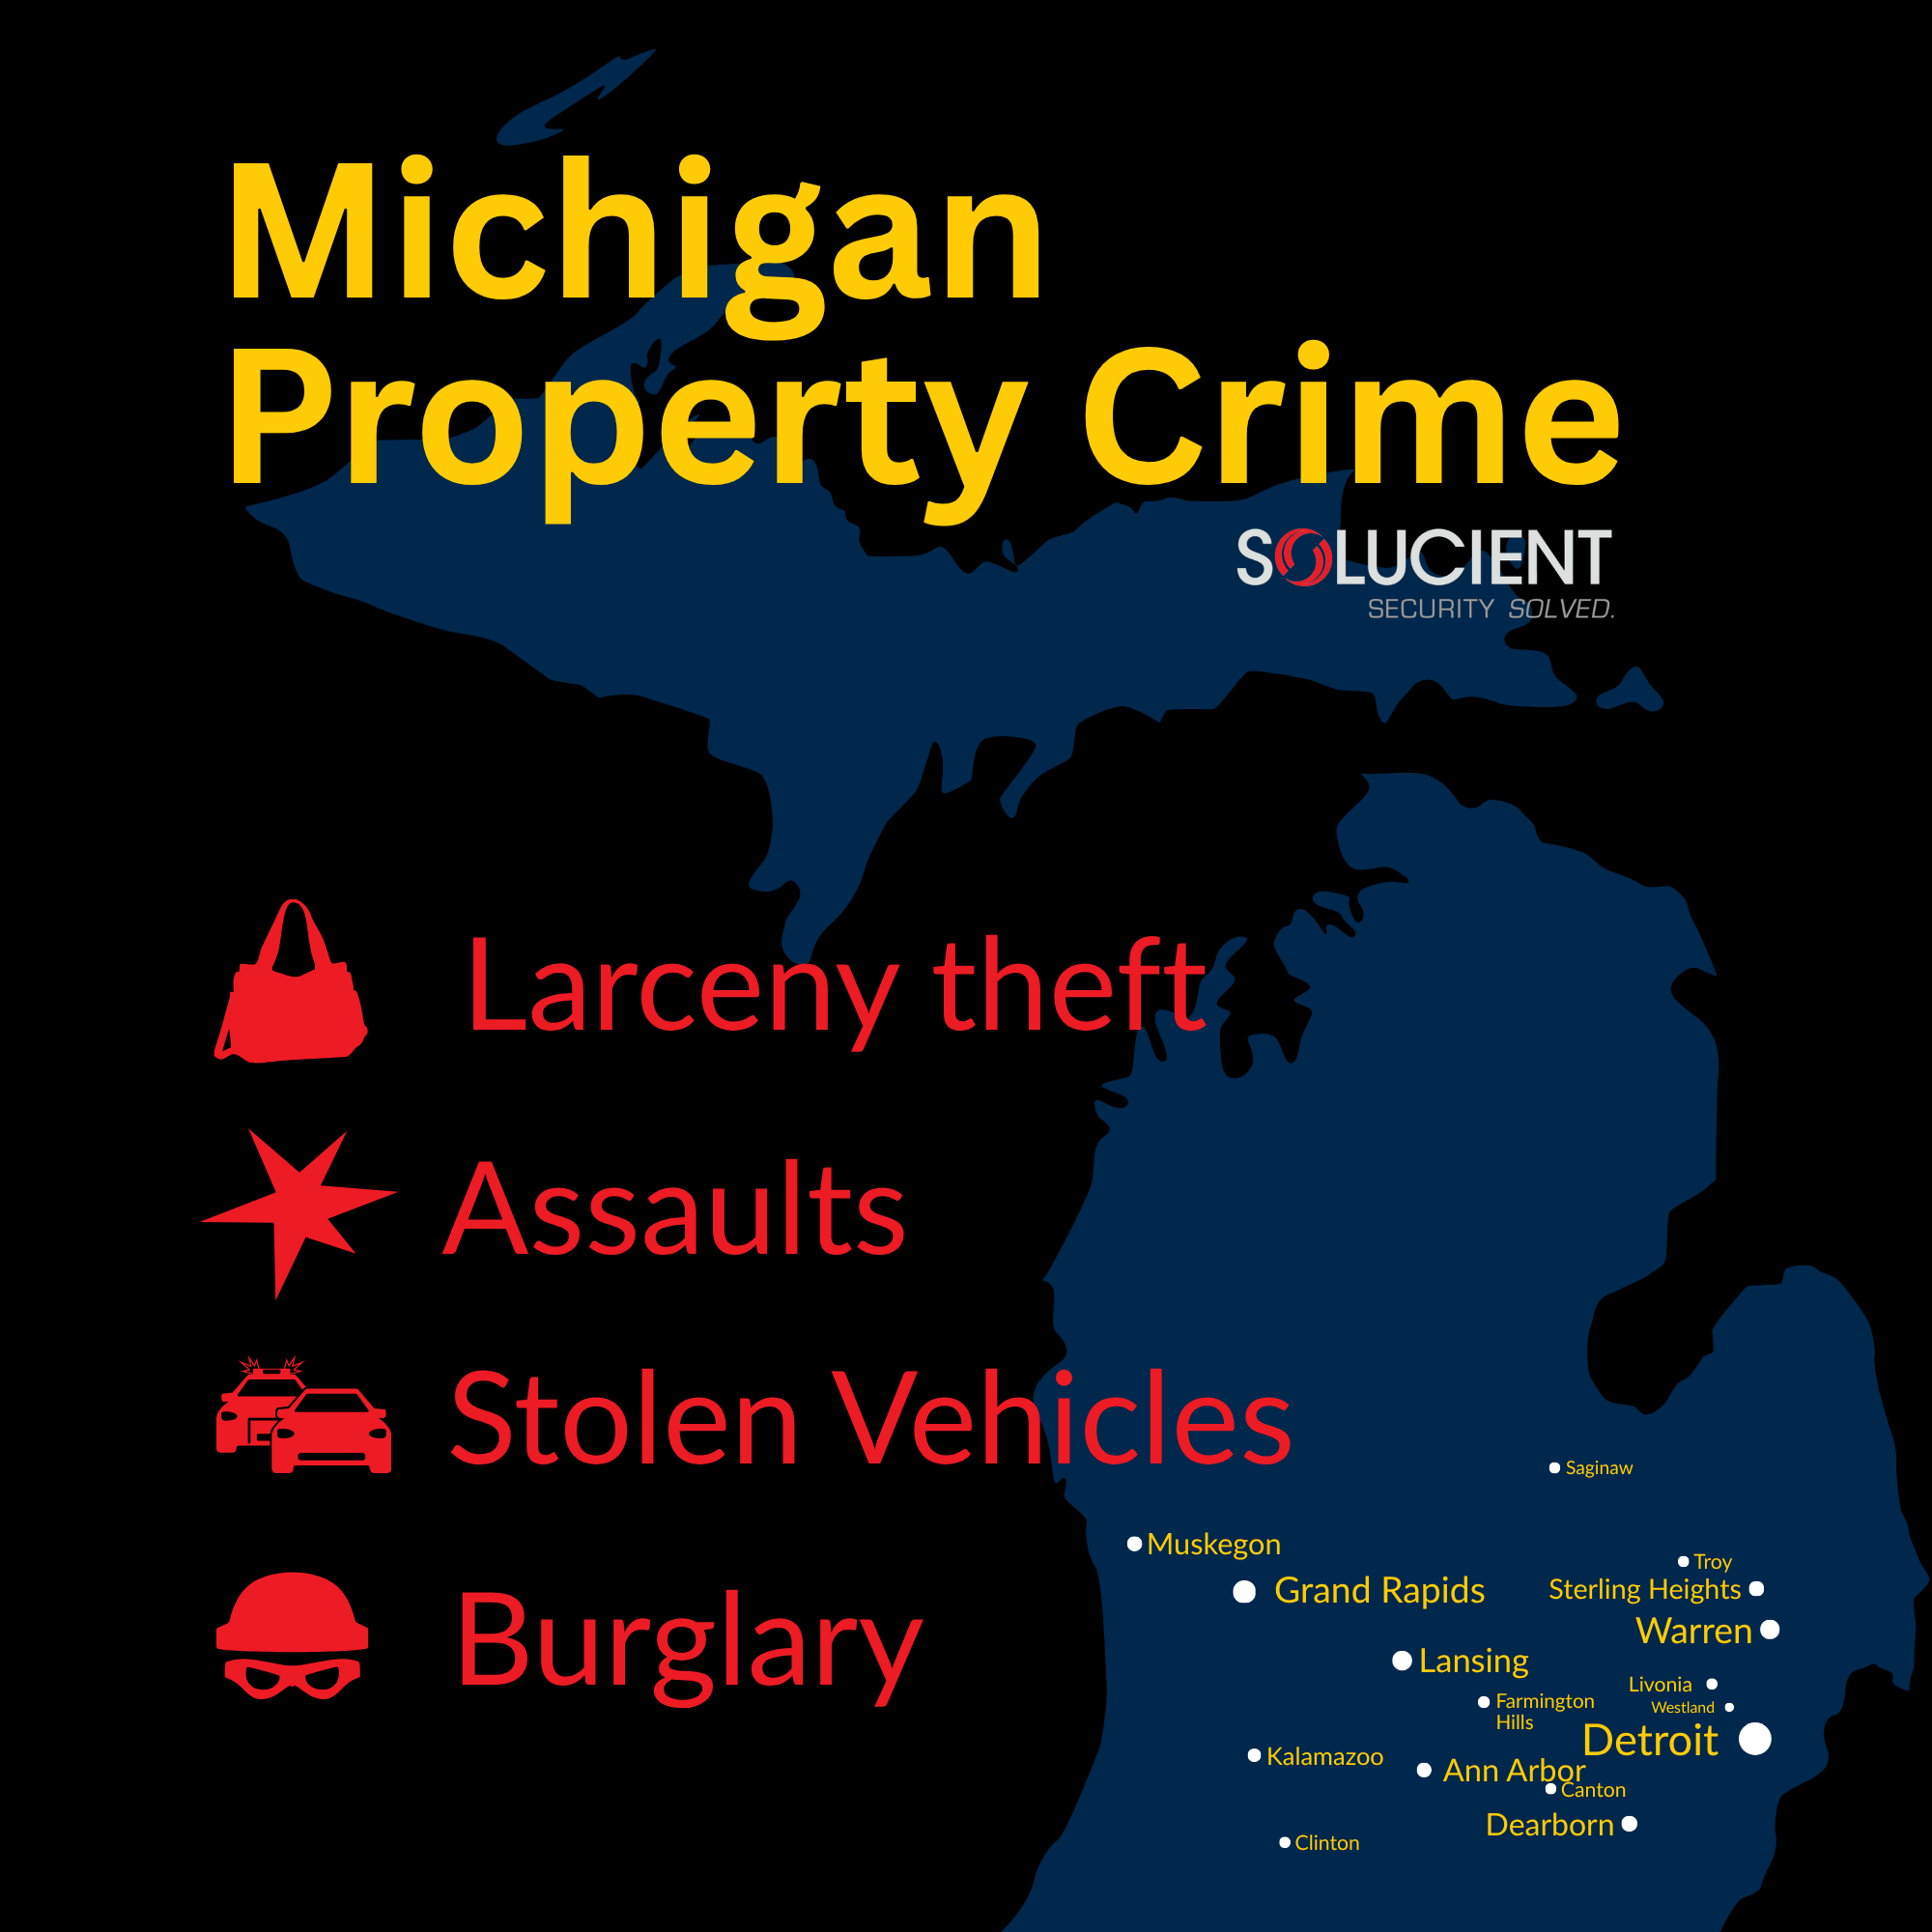
Note: Our primary focus on crimes for this topic are property crimes: the four highest types in Michigan. The highest rates by type of crime are burglary, aggravated assault, larceny-theft and car thefts.
County |
Total |
% of Pop* |
Per 1k Residents |
Per Capita |
Equivalent |
|---|---|---|---|---|---|
Kalamazoo |
7k | 2.67% | 26.7 | .02670 | 1 per 37.5 |
Wayne |
45.3k | 2.57% | 25.66 | .02566 | 1 per 39 |
Calhoun |
2.9k | 2.21% | 22.07 | .02207 | 1 per 45.3 |
Ingham |
5.6k | 1.94% | 19.35 | .01935 | 1 per 51.7 |
Berrien |
2.7k | 1.8% | 17.96 | .01796 | 1 per 55.7 |
Kalamazoo County ranks highest at 26.7 property crimes per 1,000 residents, followed by Wayne (25.66), Calhoun (22.07), Ingham (19.35) and Berrien (17.96). Among larger counties, Grand Traverse and Livingston have the lowest reported overall crime rates.
*Property Crimes Rounded to nearest 100th. Equivalent: Single incidents per resident. Percentage is just the incident rate expressed as a percentage of population.
Table of Contents
Filling out this form could
save your business someday
Michigan Crime Map:
Counties and Cities With the Lowest Reported Crime Rates
Among Michigan counties with at least 50,000 residents, Grand Traverse County had the lowest combined violent and property crime rate in 2024 at 4.91 reported crimes per 1,000 residents. Livingston County followed at 5.91, with Clinton, Newaygo and Lapeer counties also ranking among the lowest. These rates combine violent crimes such as murder, rape, robbery and aggravated assault with property crimes including burglary, larceny and motor vehicle theft.
Among incorporated Michigan cities with populations of at least 20,000, Rochester Hills recorded the lowest rate at 6.29 reported crimes per 1,000 residents, followed by Birmingham, Marquette, Novi and Midland. Population thresholds were used to prevent very small communities with only a handful of reported incidents from disproportionately dominating the rankings, making the comparison more useful for evaluating larger Michigan communities. This is evident in our Michigan Crime Map.

Grand Traverse County
Only 4.91 violent or property crimes per 1,000 residents
Livingston
Second among larger counties with low crime at 5.91 crimes per 1,000 residents.
Rochester Hills
Lowest rate among larger Michigan cities at 6.29 crimes per 1,000 residents.
Other Low-Crime Cities
Birmingham, Marquette, Novi and Midland also among Michigan’s large low-crime cities
Michigan Crime Map Trends:
Is Crime Increasing or Decreasing in Michigan?
Crime rates have dropped significantly in Michigan – likely due to anti-theft systems in vehicles, more compassionate public safety programs and increased funding in safety projects. From 2023 to 2024, reported crime fell substantially across all three major propterty crime categories: larceny-theft, burglary & motor vehicle theft.
National Crime Trends in the United States vs Michigan
The broader national trend has continued in the same direction. In August 2026, the FBI released its final 2025 Reported Crimes in the Nation data, reporting a 9.3% decline in violent crime from 2024 to 2025. Murder fell 18.1%, robbery fell 18.5%, aggravated assault fell 7.2% and SA fell 7.6%. The FBI also reported another nationwide decline in property crime.
That does not mean every Michigan community or property experienced the same trend. Statewide totals can fall while individual counties and cities continue to experience comparatively high concentrations of property crime.
Michigan Crime Map:
Which Counties Have the Highest Property Crime Rates?
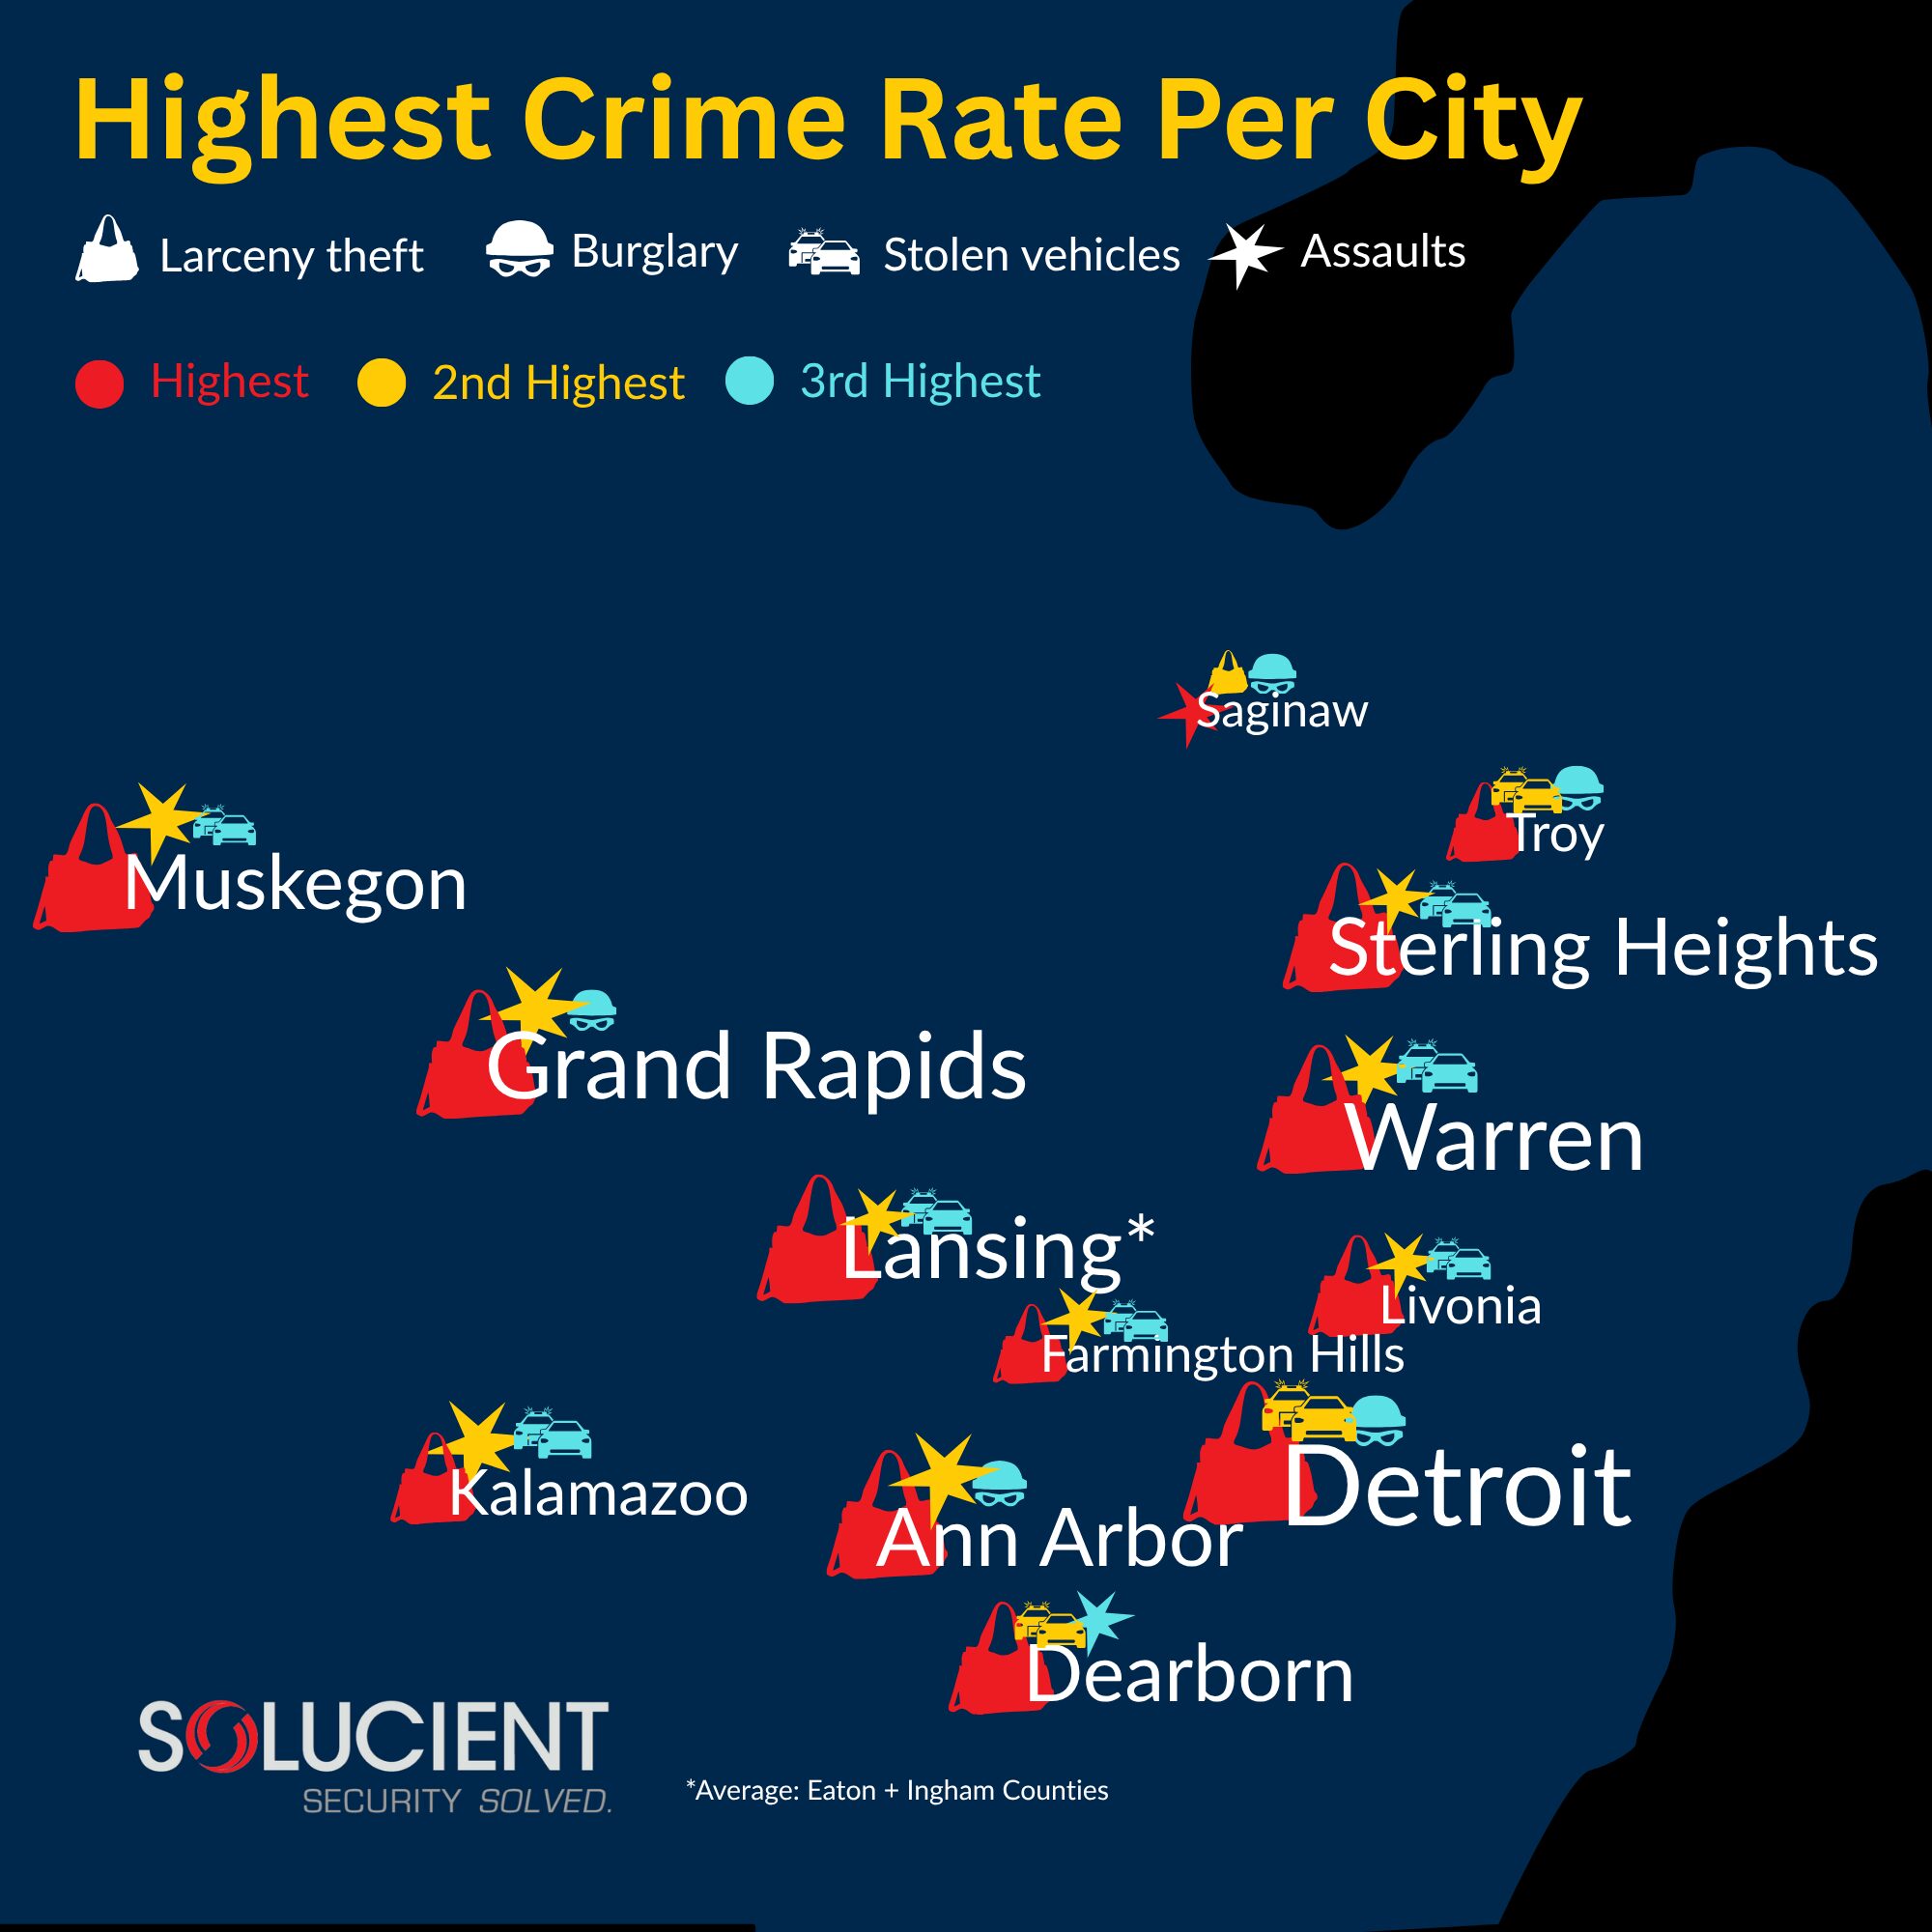
The Michigan Crime Map 2026 shows where reported property crime is most concentrated across Michigan and which major crime category was most prevalent in selected cities. For consistent city-to-city comparisons, this report uses the latest complete statewide Michigan State Police city/township table available for a static comparison: 2024 crime data.
Michigan reported 139,940 property crimes in 2024, down approximately 9.5% from 154,590 in 2023. Violent crime also declined, falling from 45,060 reported offenses in 2023 to 43,368 in 2024, a decrease of approximately 3.8%.
The most common property offense statewide remained larceny-theft, with 96,877 reported offenses in 2024. That represented approximately 69% of all reported property crime in Michigan. Motor vehicle theft accounted for 23,649 offenses, while burglary accounted for 19,414.

The most common property offense statewide remained larceny-theft, with 96,877 reported offenses in 2024. That represented approximately 69% of all reported property crime in Michigan. Motor vehicle theft accounted for 23,649 offenses, while burglary accounted for 19,414.
Why Have Crime Rates Dropped In Michigan?

Michigan’s recent decline in reported crime appears to be the result of several overlapping trends rather than one single policy, program or security measure. The state is seeing a retreat from some pandemic-era crime increases, a sharp reversal in motor vehicle theft, targeted violence-prevention efforts and substantially greater investment in public safety.
Michigan is not alone. The Council on Criminal Justice’s analysis of 40 U.S. cities found that motor vehicle theft fell approximately 24% in 2024, while residential burglary declined 13%, nonresidential burglary declined 6% and larceny declined 5%. Most of the violent-crime categories studied were also at or below their pre-pandemic 2019 levels.
Michigan’s 2024 numbers show just how significant the change has been. Compared with 2023, reported property crime fell approximately 9.5%, larceny-theft fell 7.9%, burglary fell 7.7% and motor vehicle theft fell 16.8%.
Some Pandemic-Era Crime Increases Are Continuing to Recede
Michigan’s decline fits into a much broader national pattern. The Council on Criminal Justice’s Year-End 2024 Crime Trends study examined reported crime in 40 U.S. cities with consistently available monthly data.
Researchers found that 12 of the 13 offenses studied decreased from 2023 to 2024. Among the changes:

- Motor vehicle theft declined 24%
- Residential burglary declined 13%
- Nonresidential burglary declined 6%
- Larceny declined 5%
- Robbery declined 10%
- Homicide declined 16%
- Gun assault declined 15%
The study also found that most of the violent-crime categories examined had returned to or fallen below 2019 levels by 2024.
That suggests part of Michigan’s decline may reflect a continued unwinding of the unusually disruptive crime patterns that emerged during and immediately after the COVID-19 pandemic.
It does not mean every crime has returned to pre-pandemic levels. Aggravated assault and gun assault remained somewhat higher than in 2019 in the Council’s city sample.

The Motor Vehicle Theft Surge Began to Reverse
Motor vehicle theft deserves special attention because it had increased unusually quickly before falling.
The Council on Criminal Justice found that average motor vehicle theft rates in its participating cities increased:
- 15% from 2019 to 2020
- 12% in 2021
- 25% in 2022
- 25% again in 2023
That trend finally reversed in 2024, when vehicle theft fell approximately 24%. Even after the decline, however, the average vehicle-theft rate remained 53% higher than in 2019. Read the Council on Criminal Justice motor vehicle theft findings
So Michigan’s 16.8% decline in motor vehicle theft looks dramatic partly because it followed several years of elevated theft.
Anti-Theft Technology May Have Helped Reduce Vehicle Theft
Changes to frequently targeted Hyundai and Kia vehicles also appear to have contributed to falling theft rates.
Certain model-year Hyundai and Kia vehicles became frequent theft targets after videos demonstrating vulnerabilities in their ignition systems circulated widely on social media.
The manufacturers began offering anti-theft software upgrades in February 2023.
Research from the Highway Loss Data Institute, an affiliate of the Insurance Institute for Highway Safety, found that eligible Hyundai and Kia vehicles that received the software had theft claim frequencies 53% lower than comparable vehicles that had not received the upgrade.
The upgrade requires the owner’s key or an identical duplicate to be present before the vehicle can start.

This does not explain Michigan’s entire reduction in motor vehicle theft, but it is a concrete example of security technology changing the opportunity for a specific type of crime.
Targeted Violence Prevention: The Noticeable Effects of Detroit ShotStoppers On Community Violence Prevention

Detroit provides one of Michigan’s clearest examples of multiple prevention strategies operating simultaneously.
- 19% fewer homicides
- 25% fewer nonfatal shootings
- 15% fewer carjackings
The city finished 2024 with 203 criminal homicides, the fewest since 1965.
Detroit attributes the decline to a combination of local, state and federal law-enforcement partnerships, prosecution strategies, investigations, increased staffing, mental-health initiatives and community violence intervention.
Detroit’s ShotStoppers Program Shows What Targeted Prevention Can Look Like
One component of Detroit’s strategy has been ShotStoppers, a Community Violence Intervention program launched in 2023.
Instead of spreading resources evenly across the entire city, ShotStoppers concentrates intervention efforts in relatively small geographic areas with persistent shootings and homicides. Community organizations work with individuals and conflicts believed to be at particularly high risk of escalating into serious violence. During August through October 2024, shootings and homicides outside the ShotStoppers zones were down approximately 35% compared with the same periods during the previous two years.
Inside the six original intervention zones, reductions ranged from approximately 37% to 83%.
Earlier quarterly results also found reductions of approximately 50% and 70% in two intervention zones, although Detroit officials cautioned at the time that the program was still relatively new. These findings do not prove that ShotStoppers caused Detroit’s entire decline in violent crime. They do, however, provide evidence that focused prevention programs can coincide with particularly large reductions in narrowly targeted areas.
Has Michigan Increased Its Investment in Public Safety?
Yes. Michigan has substantially increased public-safety investment over the same broad period in which many crime categories have been declining.
That investment includes law enforcement, community violence intervention, first responders, school safety, emergency communications, training and other prevention programs.
Michigan also allocated $236 million for indigent defense. Strong criminal, of course, can lead to less criminal convictions by finding other ways to address criminal behavior like mental health programs, reduced charges or fighting off excessive criminal charges when necessary.
Finally, Michigan established dedicated Public Safety Revenue Sharing. For FY2026, $42.6 million was authorized for participating cities, villages and townships, with distributions based partly on recent violent-crime counts.
Programs Eligible For Funding & Grants
Community
Intervention

Life & Crime
Safety Training

Indigent Legal
Representation

Firefighting
Equipment
Local Safety
Programs
Law-enforcement
Recruitment
School District Safety Funding, Grants & Uses

Michigan schools are investing in a secured vestibules and controlled-entry systems through a combination of state school-safety grants, Section 31aa allocations, voter-approved bonds, and local capital funds.
In Michigan’s FY2022 Competitive School Safety Grant Program, 14 vestibule projects received a combined $888,910,
Michigan’s FY2027 Budget Continues the Investment
Michigan describes its FY2027 budget as building on nearly $2 billion in public-safety and first-responder investment across the administration’s previous budgets.
Among the FY2027 investments are:
- $50 million for public-safety revenue sharing
- $10 million for a new trooper school expected to train 50 new troopers
- $23 million for county prosecutor operations and staffing
- $10 million for the Public Safety Academy Assistance Program
- $11.3 million for training more than 18,700 law-enforcement officers
- $1 million for upgrades to Michigan’s statewide public-safety communications system
The state also reports that ongoing investment in the Michigan State Police has increased by more than $250 million during the Whitmer administration.
Michigan Has Also Funded Specialized Public-Safety Grant Programs
Public Act 166 of 2022 created six public-safety grant programs totaling $58.7 million, administered by the Michigan Commission on Law Enforcement Standards.
The programs include funding for community policing, police athletic leagues, public-safety academy assistance and specialized law-enforcement training and equipment.
The appropriations were structured as work projects that could continue through the end of FY2026 or until the available funds were exhausted.
Michigan Crime Map:
City & County Property Crime Statistics
| Category | 2023 | 2024 | Change |
|---|---|---|---|
| Property Crime | 155,590 | 139,940 | -9.5% |
| Larceny-Theft | 105,142 | 96,877 | 7.9% |
| Motor Vehicle Theft | 28,408 | 23,649 | -16.8% |
| Burglary | 21,040 | 19,414 | -7.7% |
| Violent Crime | 45,060 | 43,468 | -3.8% |
| Murder | 586 | 521 | -11.1% |
| Robbery | 3,685 | 3,169 | -14.01% |
Michigan’s Highest
Crime Rates By County
Michigan Property Crime Map:
Most Common Crimes by Type
Highest Property Crimes in Michigan

Larceny-Theft

Aggravated
Assault
Vehicle Theft

Burglary
Offenses

🚨 Larceny-theft: 96.9k
🚨 Aggr. Assault: 34.1k
🚨 Vehicle Theft: 23.6k
🚨 Burglary: 19.4k
Michigan Crime Map:
Most Prevalent Crimes in Michigan Cities
The following city comparisons use Michigan State Police’s 2024 Violent and Property Crimes by County and City/Township data and are entered into separate Michigan crime map to demonstrate types of crimes and where they are likely to occur. “Most prevalent” refers to the individual index-crime categories included in that statewide table: murder, sexual crimes, robbery, aggravated assault, burglary, larceny and motor vehicle theft.
Secure Your Business With Solucient Security
Declining crime should be viewed as encouraging progress—not as evidence that Michigan businesses, schools and organizations no longer need to invest in security. If safety protocols are neglected, there’s a good chance we will see a rise in crime again, which we of course hope to avoid.
Solucient advocates for an approach to physical security built around prevention, visibility, early detection and informed response.
Important Security Investments For Your Business

Access
Control

Video Surveillance

Mass
Notifications

Intrusion Detection

✔ Limit building access
✔ Detect intrusions sooner
✔ Coordinate emergency response
✔ Identify vulnerabilities
✔ Control industrial workflows
Schedule Your Free Security Consultation With Solucient Security
How a Professionally Designed Security System Can Keep Your Business Safe
- Reduce opportunities for unauthorized access with an access control system which scans biometrics, uses a PIN pad or phone tap
- Detect activity sooner with intrusion detection – using advanced systems in case something is missed
- Improve visibility with CCTV – especially in areas where crimes are likely to occur such as hidden pockets of buildings and parking lots
- Protect employees, visitors, inventory and equipment
- Provide better information when an incident occurs
- Coordinate a faster response using an emergency notification system customized for the needs of your business
- Identify vulnerabilities before they result in a loss
Frequently Asked Questions
Michigan Crime Rates Map 2026 Methodology
The county heat map uses 2024 Michigan State Police property-crime totals consisting of burglary, larceny and motor vehicle theft. Those totals were divided by the U.S. Census Bureau’s Vintage 2025 estimates of each county’s 2024 resident population and multiplied by 1,000.
The city analysis uses the MSP 2024 Violent and Property Crimes by County and City/Township table so every mapped location is compared under the same reporting structure.
For cities spanning more than one county, such as Lansing, the relevant city entries were combined.
The map identifies the largest individual index offense rather than treating “property crime” or “violent crime” totals as individual crimes.
Rates are useful for comparison but are not synonymous with individual risk. Tourism, commuting, universities, commercial activity, reporting practices, population size and law-enforcement data submission can all affect apparent crime concentrations.
MSP also explains that city/township geographic counts can differ from FBI agency-based statistics, making it important to avoid mixing methodologies in a single ranking.
Operating in one of these counties? Solucient designs and monitors commercial video surveillance, access control and intrusion detection for Michigan businesses, with verified alarm response from our own Michigan central station. Request a complimentary security review.